#yum provides /usr/bin/ab
......
httpd-tools-2.2.15-30.el6.centos.x86_64 : Tools for use with the Apache HTTP
                                        : Server
Repo        : updates
Matched from:
Filename    : /usr/bin/ab
......
for var in {4,20,50,100,150,200,300} do ab -g plot/biz$var.dat -r -c ${var} -n ${total} -H 'Accept:application/xml' -p request.xml -T 'application/xml' http://localhost:8080/app/biz
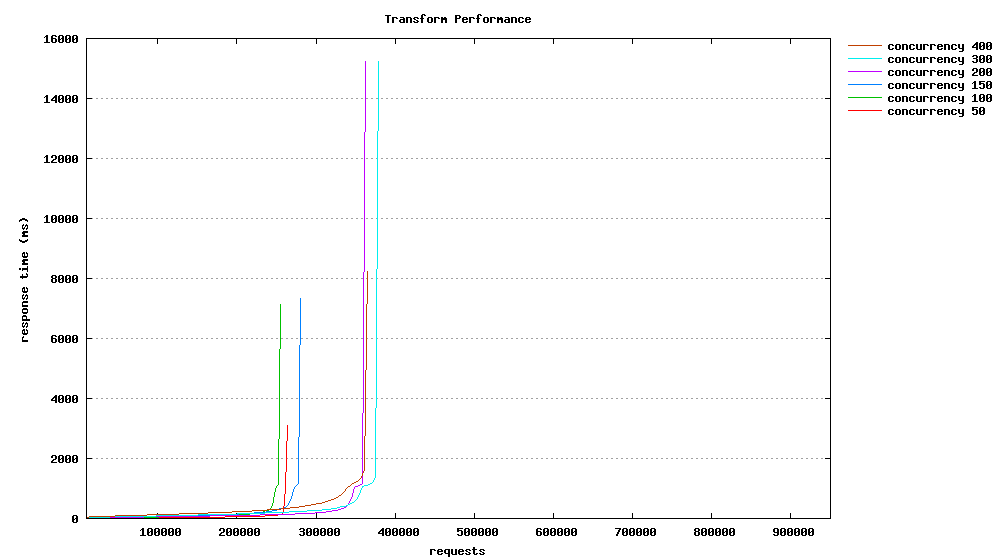
#graph title settitle"Biz Performance" setkeyinvertreverseLeftoutside
#nicer aspect ratio for image size #set size 1,0.7
# y-axis grid setgridy
#x-axis label setxlabel"requests"
#y-axis label setylabel"response time (ms)" #plot data from "biz.dat" using column 9 with smooth sbezier lines #and title of "Biz Performance" for the given data plot"biz4.dat"using9smoothsbezierwithlinestitle"concurrency 4",\ "biz20.dat"using9smoothsbezierwithlinestitle"concurrency 20",\ "biz50.dat"using9smoothsbezierwithlinestitle"concurrency 50",\ "biz100.dat"using9smoothsbezierwithlinestitle"concurrency 100",\ "biz150.dat"using9smoothsbezierwithlinestitle"concurrency 150",\ "biz200.dat"using9smoothsbezierwithlinestitle"concurrency 200",\ "biz300.dat"using9smoothsbezierwithlinestitle"concurrency 300"
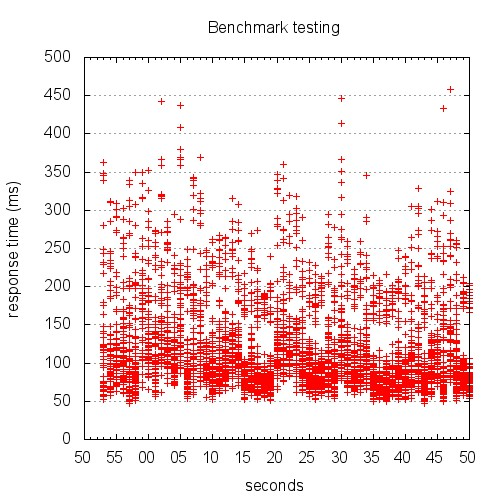
# Let's output to a jpeg file setterminaljpegsize500,500 # This sets the aspect ratio of the graph setsize1,1 # The file we'll write to setoutput"graphs/timeseries.jpg" # The graph title settitle"Benchmark testing" # Where to place the legend/key setkeylefttop # Draw gridlines oriented on the y axis setgridy # Specify that the x-series data is time data setxdatatime # Specify the *input* format of the time data settimefmt"%s" # Specify the *output* format for the x-axis tick labels setformatx"%S" # Label the x-axis setxlabel'seconds' # Label the y-axis setylabel"response time (ms)" # Tell gnuplot to use tabs as the delimiter instead of spaces (default) setdatafileseparator'\t' # Plot the data plot"data/testing.tsv"every::2using2:5title'response time'withpoints exit